

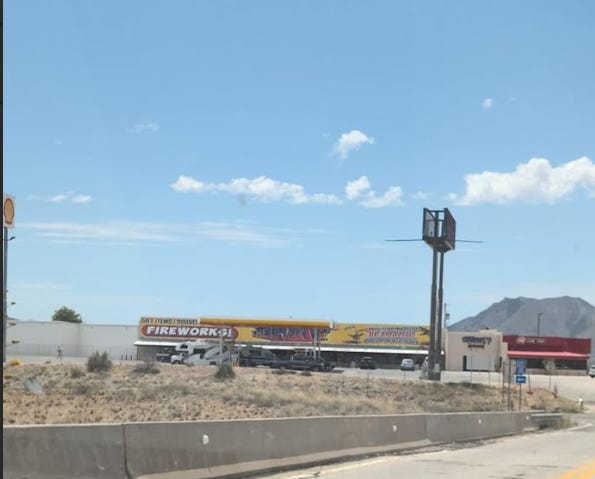
Figure 1 Author’s personal picture: The Thing remains one of southeastern Arizona's most recognizable roadside landmarks. While the attraction itself changed little over the past several decades, the agricultural landscape surrounding it tells a very different story.
If you’ve driven Interstate 10 between Willcox and San Simon, you’ve probably noticed the same landmarks I have.
The billboards for The Thing still rise from the desert, promising answers to questions nobody asked. Apple Annie’s still draws visitors looking for apples, pie, pumpkins, and a taste of rural Arizona. The mountains remain where they’ve always been, watching over the valley.
At ground level, the landscape feels familiar.
But over the last twenty-seven years, something remarkable has happened.
Most drivers never noticed it.
I didn’t either.
A Question from the Highway
This article started with a simple observation.
Every time I drove through southeastern Arizona, I noticed more orchards.
At first it was just a passing thought.
Then it became a question.
When did all these trees get here?
Pecan orchards don’t appear overnight. A grower planting pecans is making a decision that may take a decade or more to fully pay off. Unlike annual crops, orchards represent a long-term commitment.
So I started looking through historical satellite imagery.
What I found surprised me.
Looking Back in Time
The oldest imagery shows a landscape dominated by traditional irrigated agriculture.
Large center-pivot fields were common throughout the valley. From above, the landscape looked much like countless agricultural regions across the American West.
Nothing in those early images suggested that permanent orchards would eventually occupy large portions of the area.
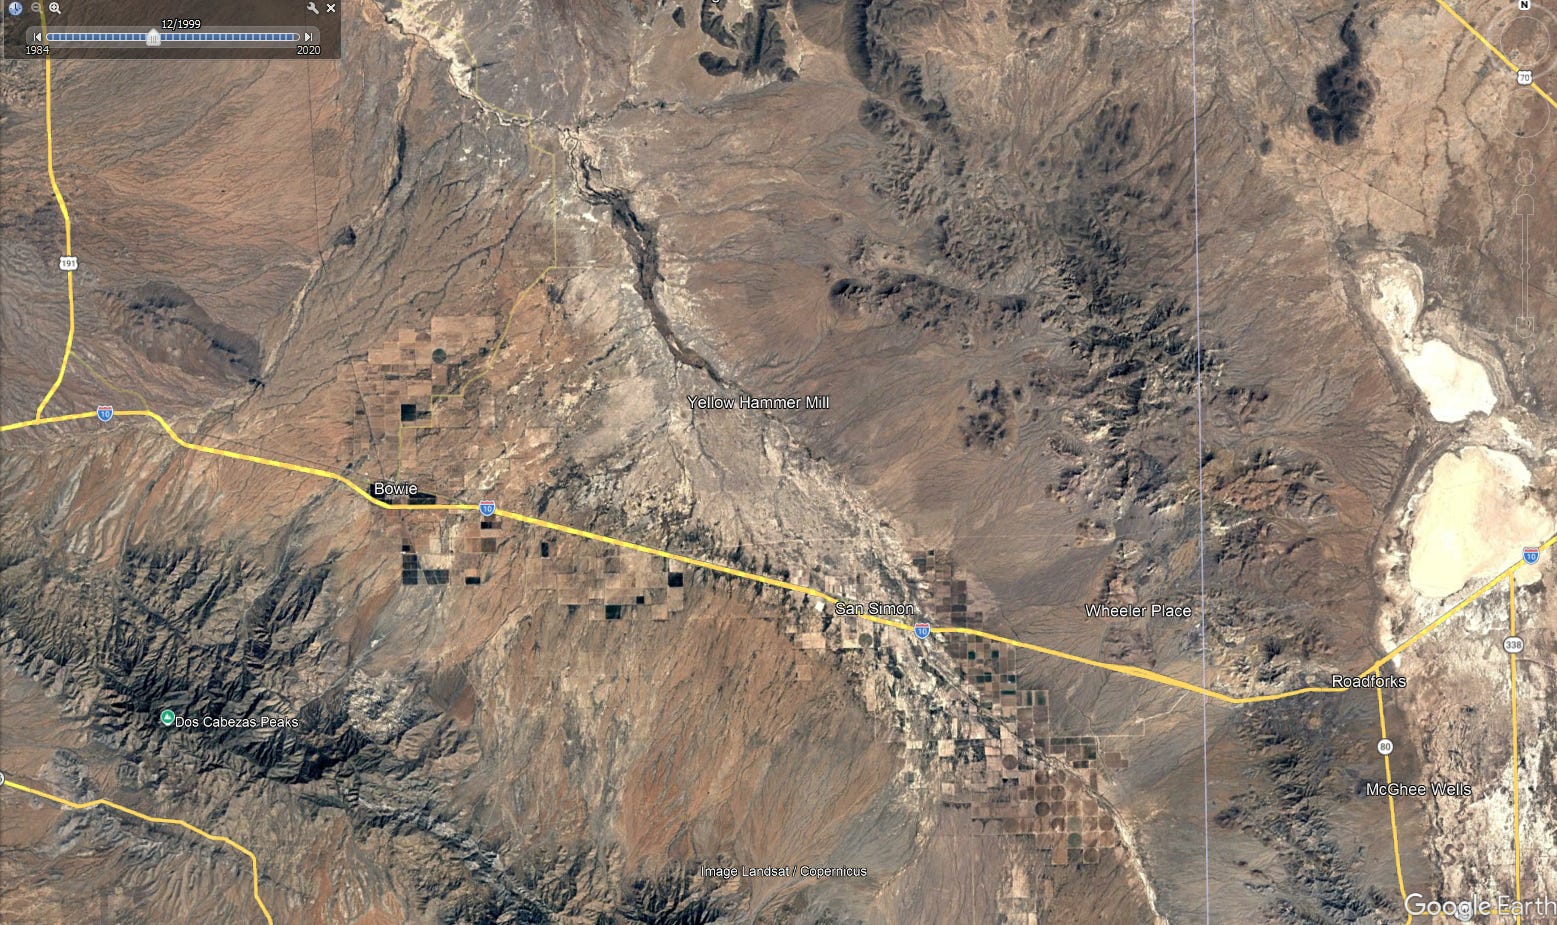
Figure 2: Google Earth historical imagery, Bowie/San Simon region, 1999
For years, very little appeared different.
Then subtle changes began to emerge.
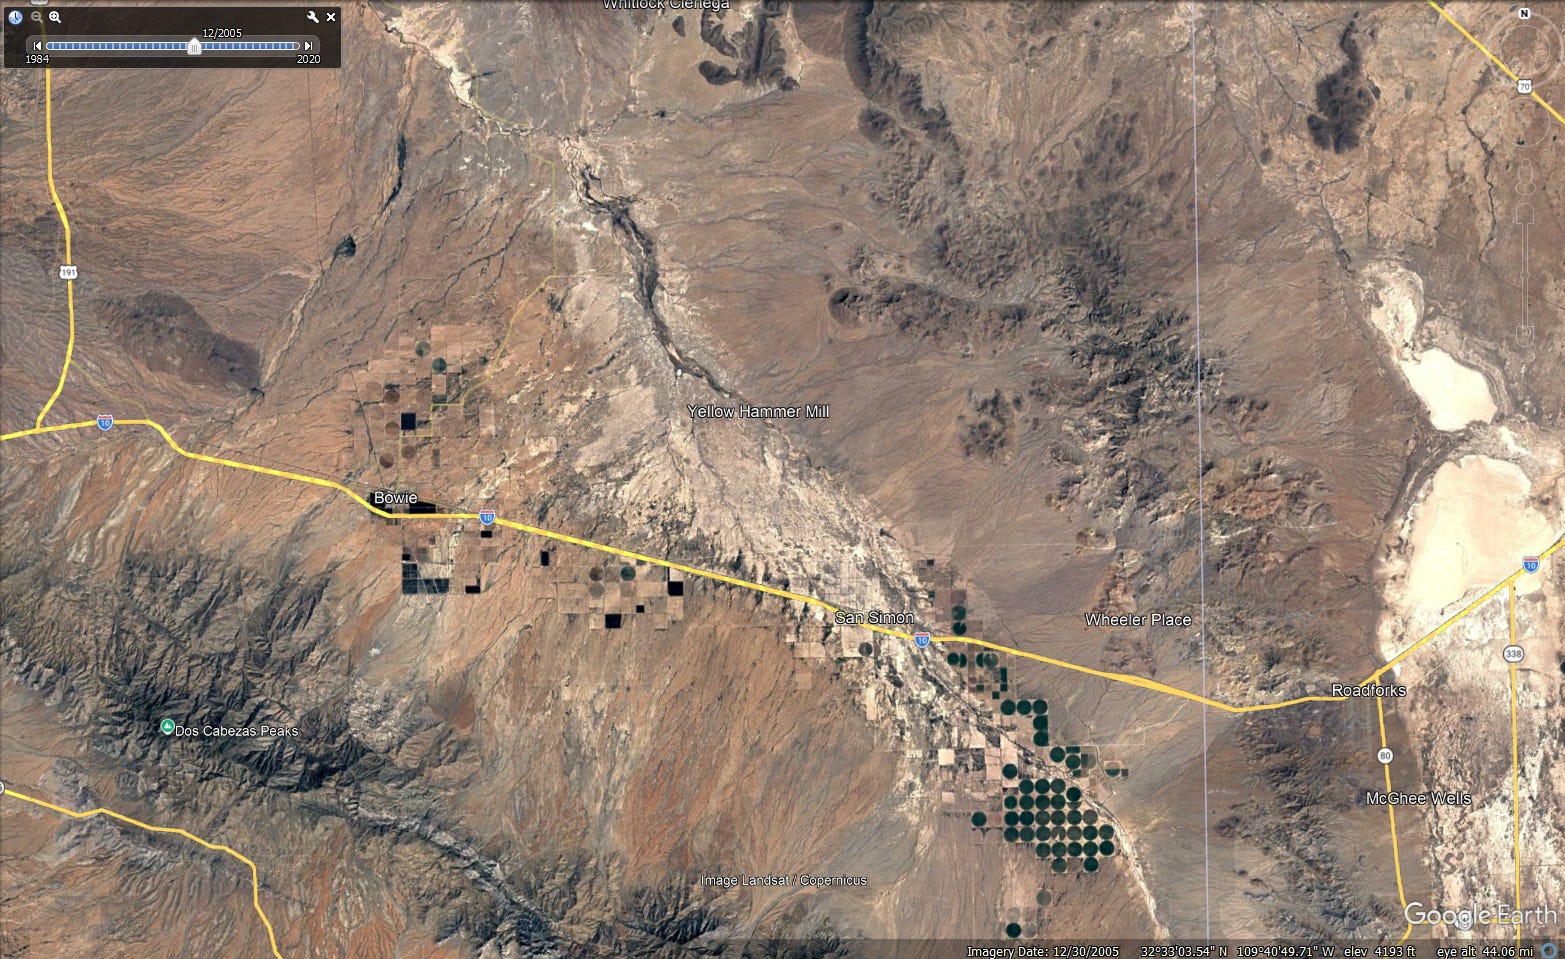
Figure 3: Google Earth historical imagery, Bowie/San Simon region, 2005
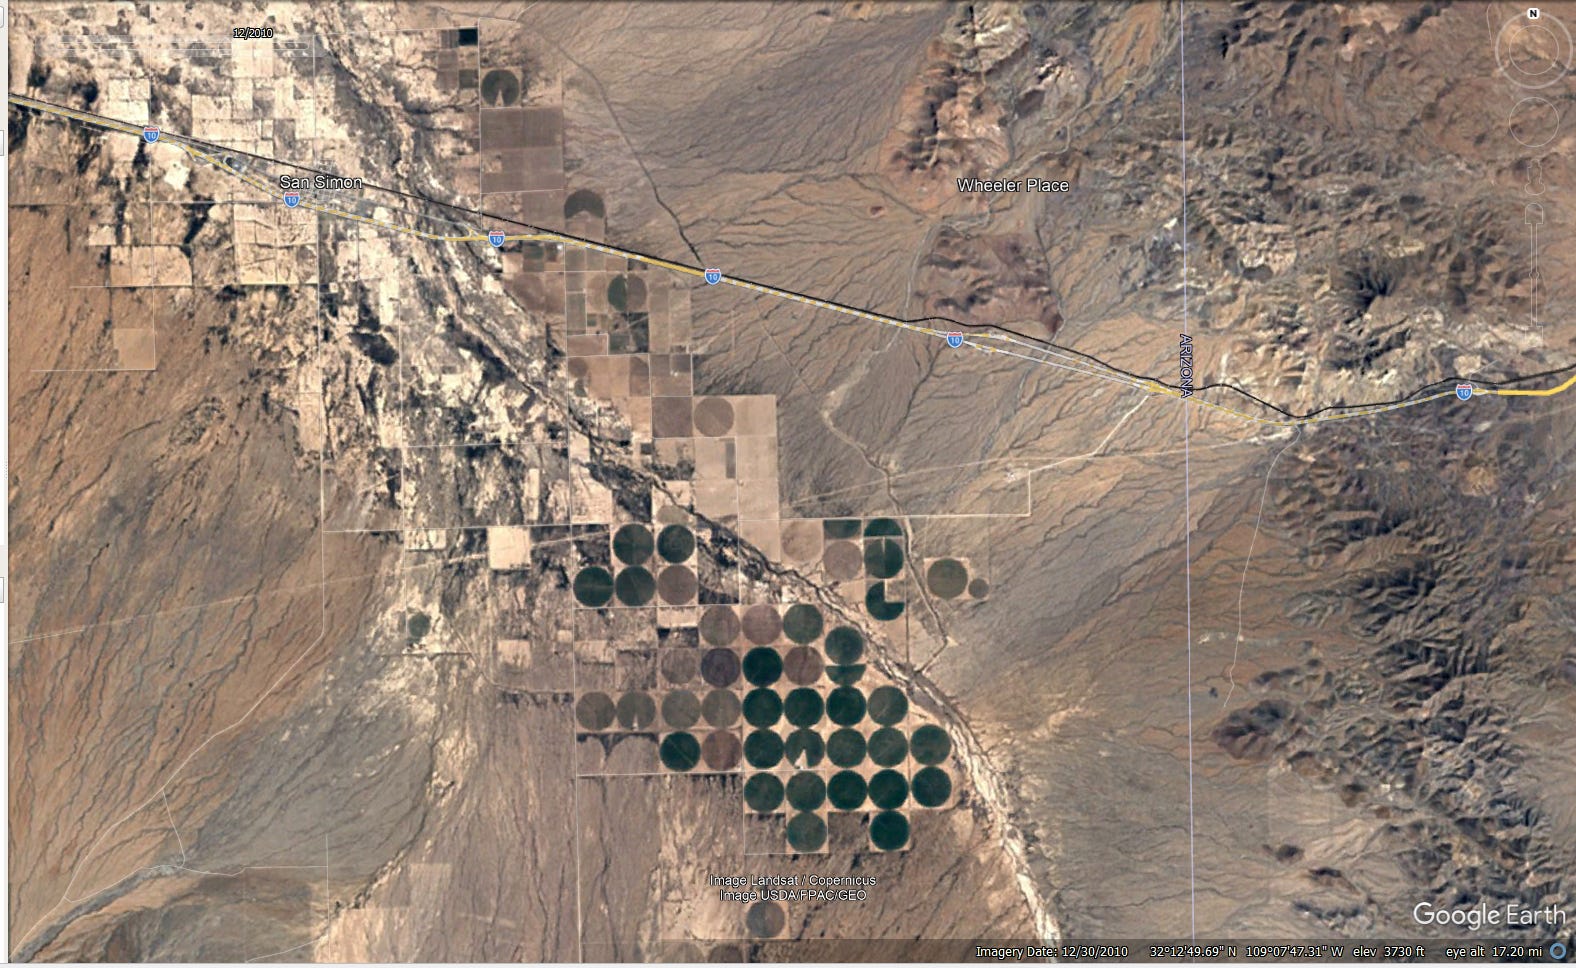
Figure 4: Google Earth historical imagery, San Simon region zoomed in, 2010
The circles remained.
The farms remained.
But new patterns started appearing.
The Rows Appear
By the mid-2010s, those patterns became difficult to ignore.
What had once been traditional fields began showing organized rows.
The change was gradual enough that it would have been easy to miss while driving past at 75 miles per hour.
The satellite imagery, however, never forgets.
Year after year, more rows appeared.
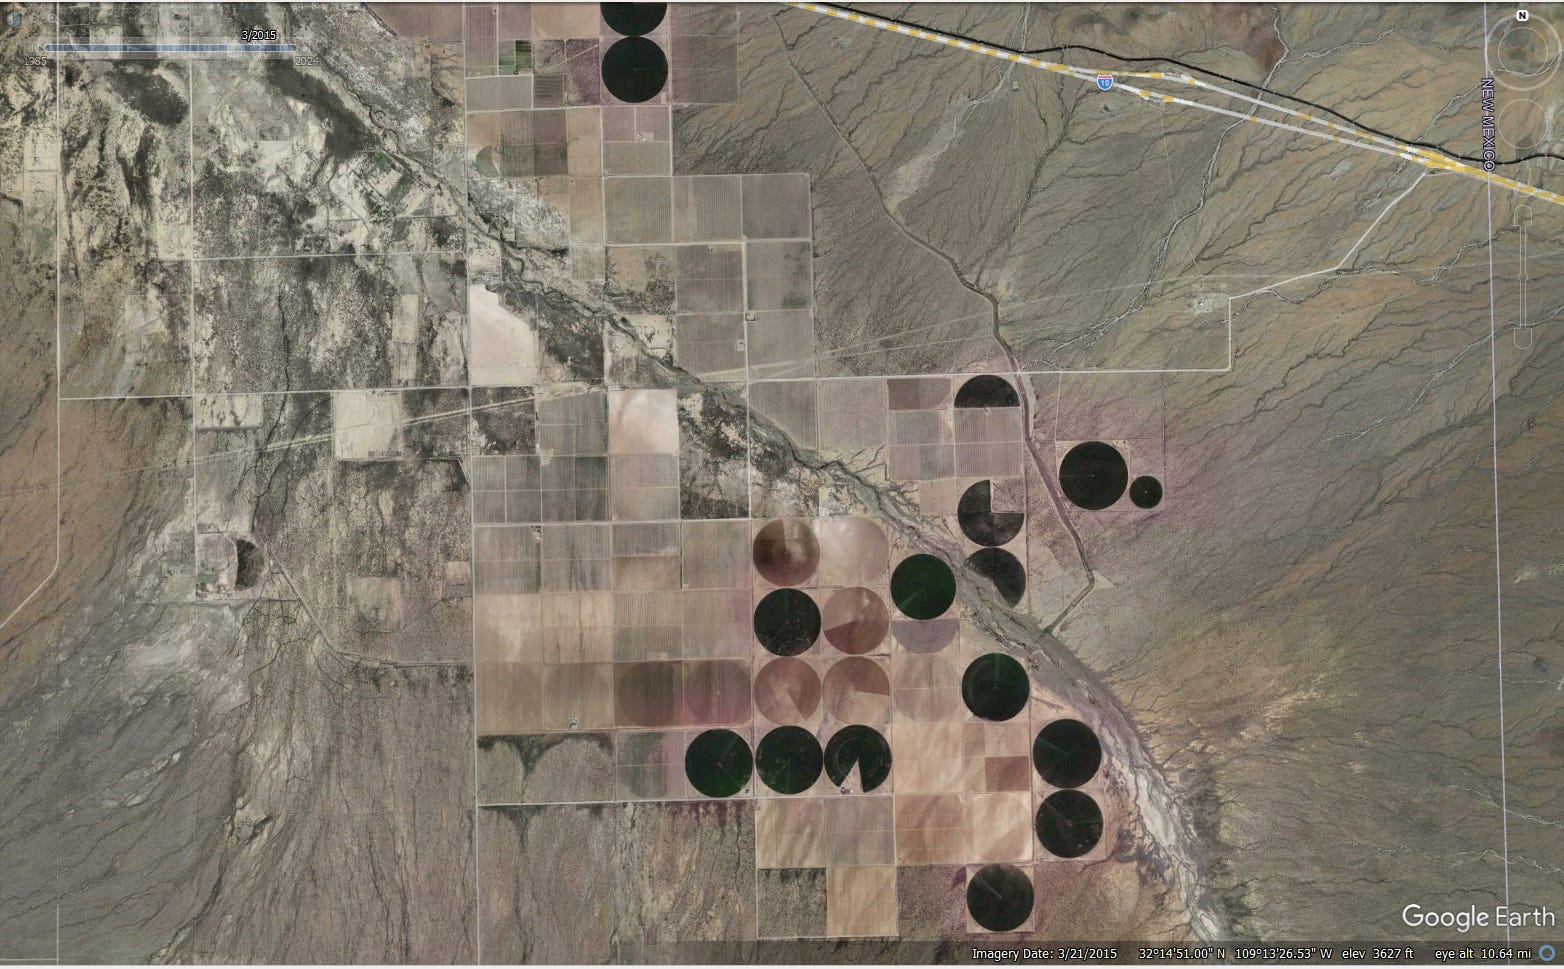
Figure 5: Google Earth historical imagery, San Simon region zoomed in even more, 2015
Those rows represented something important.
Someone had decided to make a long-term bet.
Not on next year’s crop.
Not on next season’s commodity prices.
On the next several decades.
The Canopy Grows
The imagery from 2020 reveals the next stage of the transformation.
The young rows begin to fill in.
Trees become visible.
Canopy coverage expands.
What once looked like ordinary agricultural fields now clearly resembles permanent orchard infrastructure.
The transformation is no longer subtle.
It is visible from space.
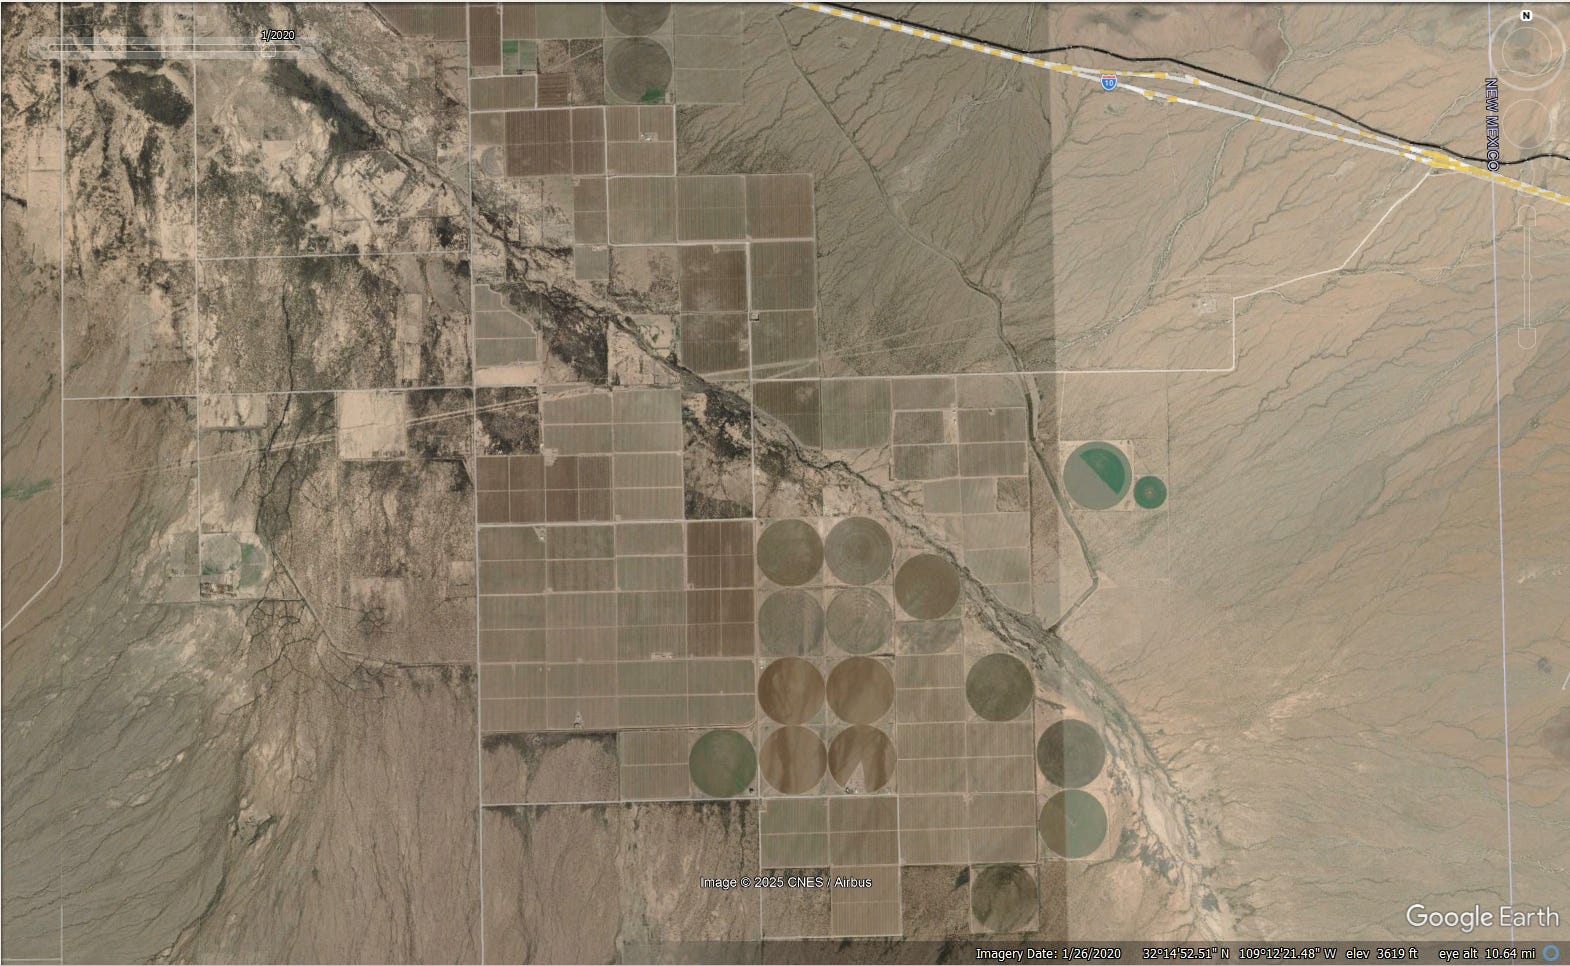
Figure 6: Google Earth historical imagery, San Simon region zoomed in even more, 2020
The Valley Today
The most recent imagery completes the story.
Large mature orchards now occupy land that once supported traditional field agriculture.
Viewed year by year, the changes appear modest.
Viewed across twenty-seven years, they are dramatic.
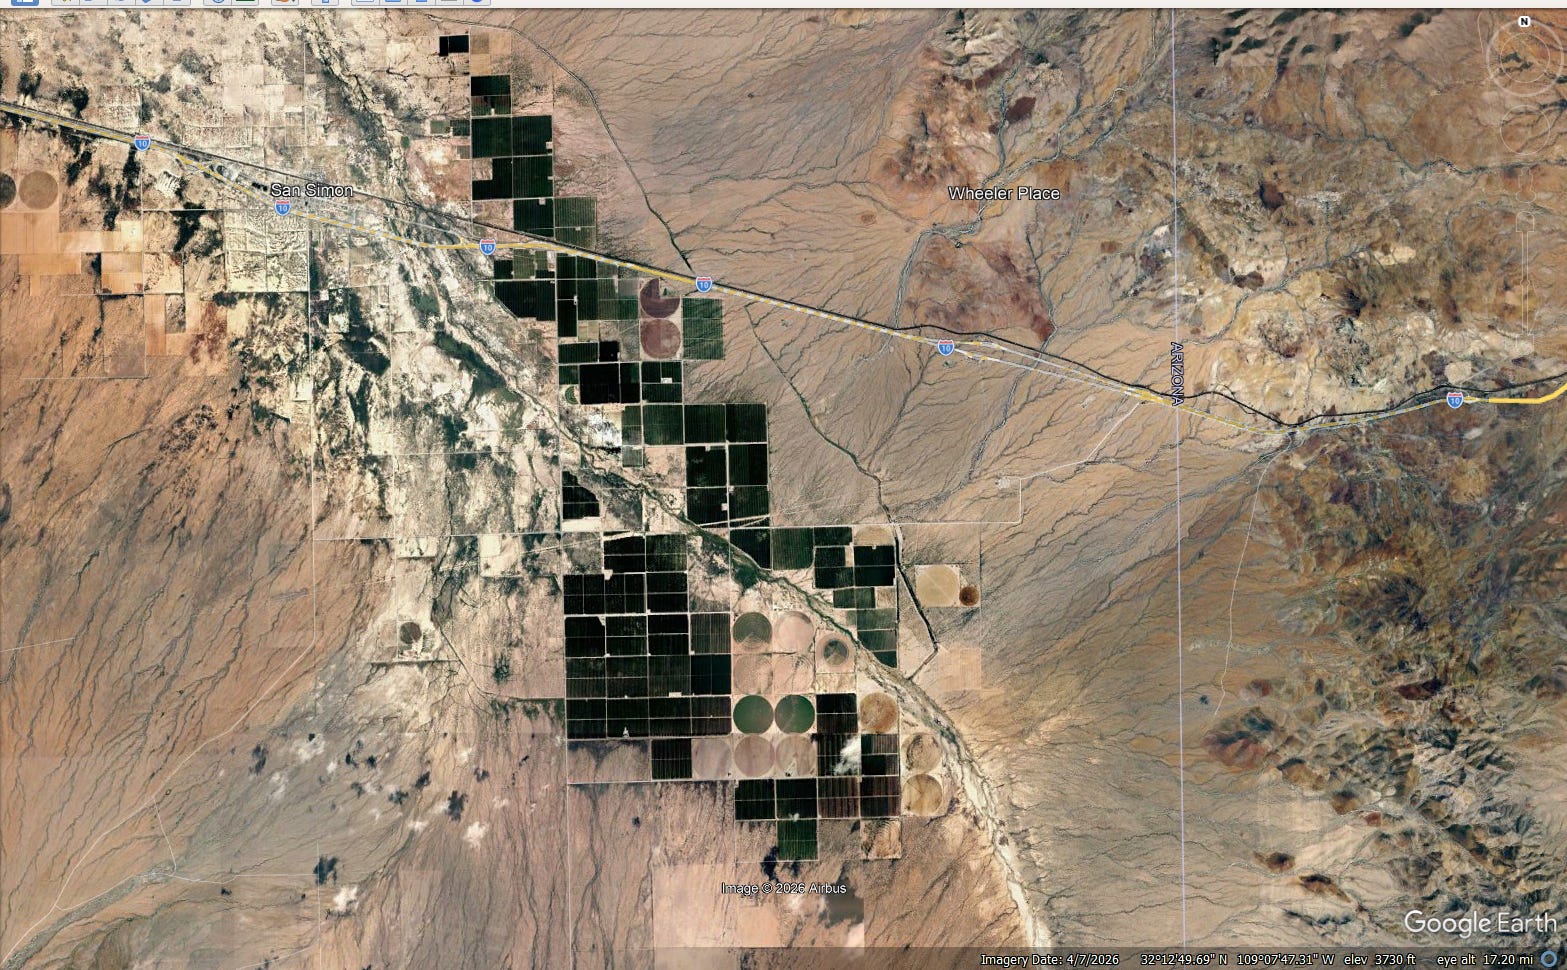
Figure 7: Google Earth historical imagery, San Simon region zoomed in even more, 2026
Today the landscape is dotted with solar farms and expanding pecan orchards, even though familiar institutions remain. Travelers still stop at Apple Annie’s. The Thing still lures visitors off the highway. The mountains still frame the horizon.
The roadside landmarks remained.
The agricultural landscape evolved around them.
That is the story hidden in twenty-seven years of satellite imagery.
A Clue from Bowie
One detail stood out while reviewing the imagery.
The orchards around Bowie were already established in many of the earliest images. Mature tree canopies were visible long before similar patterns appeared farther east near San Simon.
In effect, Bowie showed what a mature orchard landscape looked like and provided a glimpse of San Simon’s future.
Over the following two decades, portions of San Simon gradually began to resemble it.
The timing is difficult to ignore.
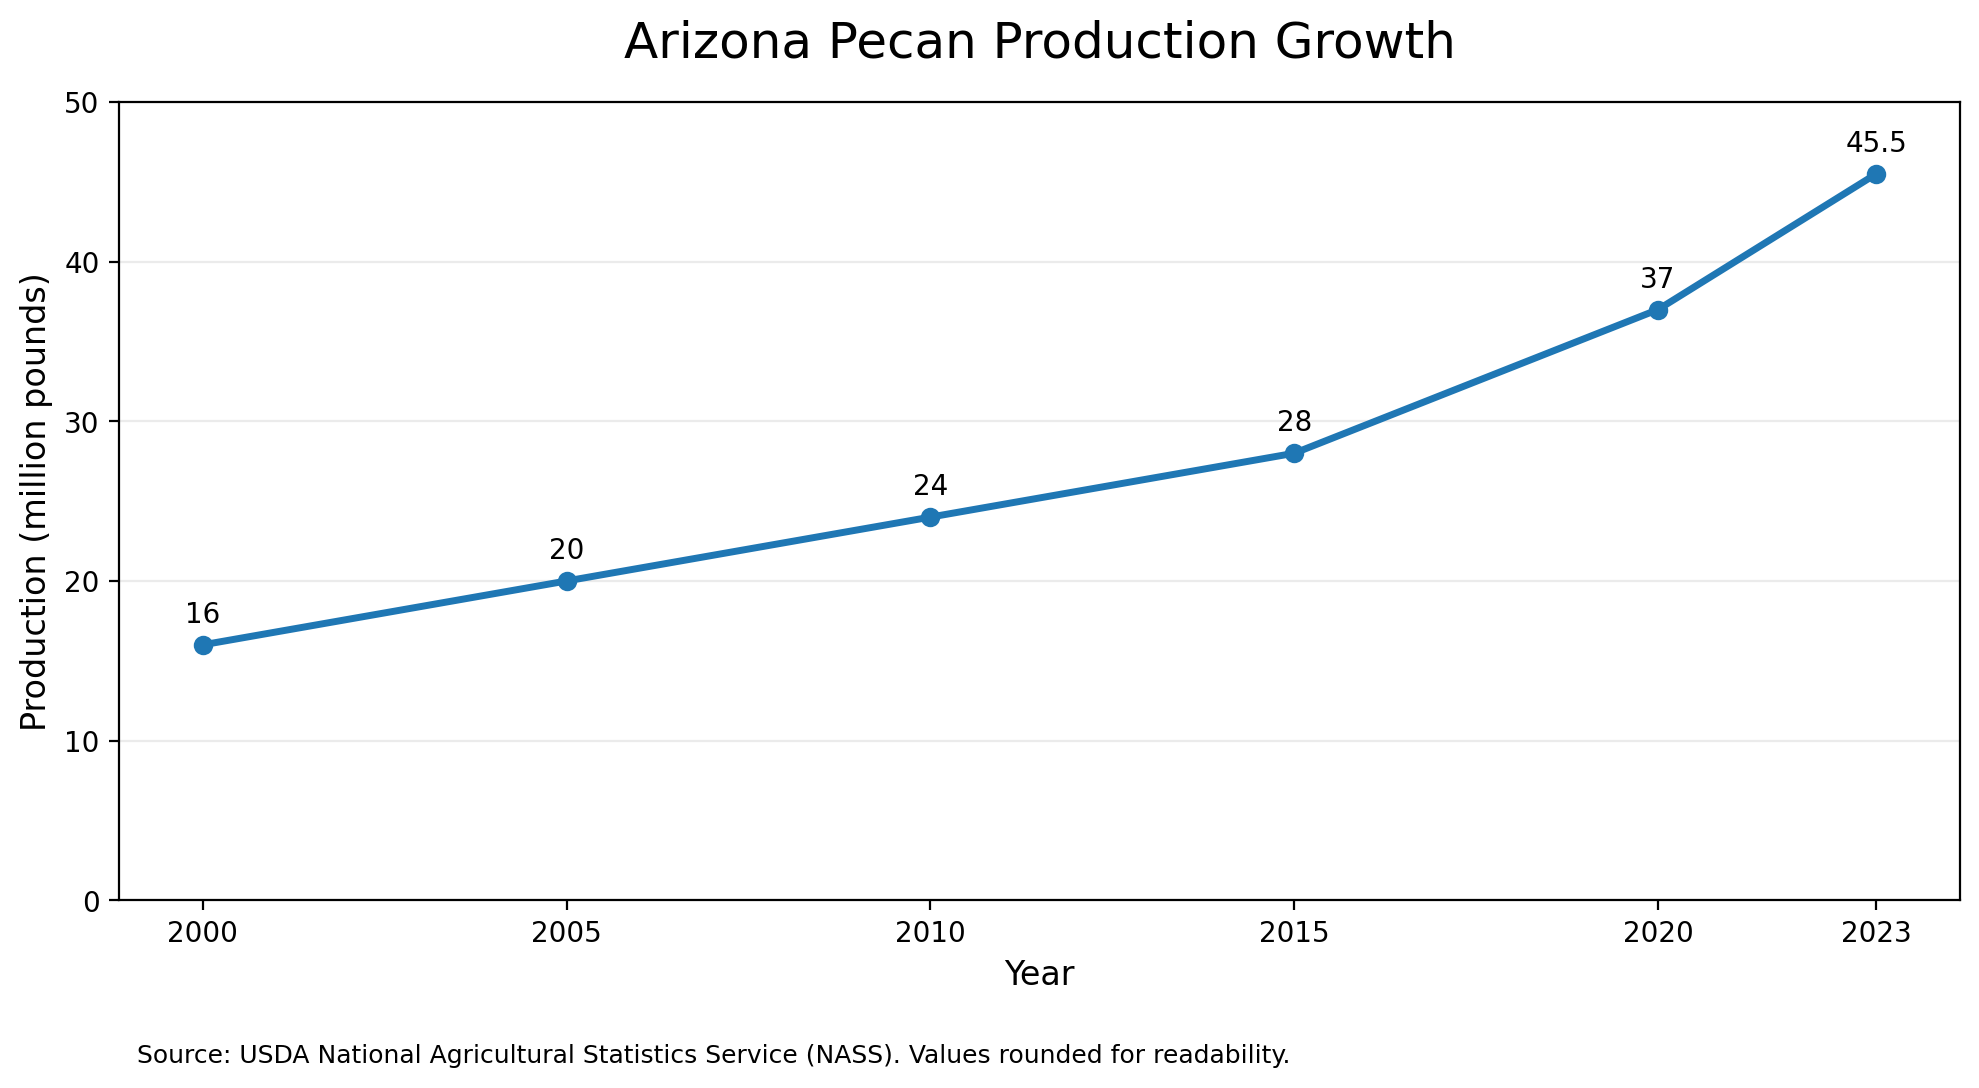
Arizona produced approximately 16 million pounds of pecans in 2000. By 2023, annual production had grown to roughly 45 million pounds, while bearing acreage expanded across southern Arizona.
The satellite imagery and statewide production data tell a remarkably similar story.
One shows the industry growing.
The other shows where that growth occurred.
Together, they suggest that the orchards appearing in the imagery were not isolated projects, but part of a broader expansion of Arizona’s pecan industry.
That contrast is what makes the transformation so striking.
Why Pecan Trees?
The imagery shows what happened. Economics may help explain why.
While every grower faces different costs, risks, and market conditions, the relative economics of various land uses help illustrate why permanent orchards became an attractive long-term investment:
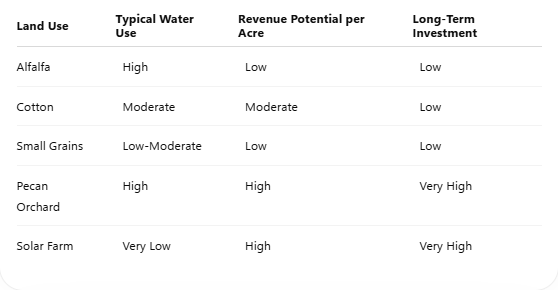
Source: University of Arizona Extension publications, USDA agricultural statistics, and industry reports. Values are shown as relative comparisons intended to illustrate economic incentives rather than represent specific farm profitability. Actual water use, costs, and returns vary by location, commodity prices, yields, and management practices.
Why Make the Bet?
The satellite images show what happened.
They do not tell us why.
But they provide clues.
Pecan orchards require patience. Trees take years before producing meaningful crops and more than a decade before reaching maturity. Growers must invest significant capital long before seeing the full return.
Nobody plants thousands of acres of pecans expecting a quick payoff.
The decision only makes sense if the long-term economics justify the investment.
Water has value.
Land has value.
Time has value.
The orchards themselves suggest that growers believed the long-term opportunity justified the risk.
The trees are evidence of that belief.
What the Images Really Show
This is not just a story about pecans.
It is a story about adaptation.
The satellite imagery captures something that is easy to miss when change occurs slowly.
Over nearly three decades, southeastern Arizona evolved.
Fields became orchards.
Young plantings became mature canopy.
One planting season at a time, the landscape changed.
Sometimes the most important stories are not found in reports, policy papers, or spreadsheets.
Sometimes they are visible from 400 miles above the Earth.
And once you see them, they are impossible to ignore.
The orchards stretching across southeastern Arizona are more than trees.
They are a visible record of thousands of long-term decisions made over decades.
A bet on land.
A bet on water.
A bet on the future.
And perhaps most interestingly, much of this transformation occurred before Arizona faces some of its most significant anticipated reductions in Colorado River water supplies.
The landscape was already adapting.
The orchards visible from space suggest that the economics of water were evolving long before many of the hardest decisions arrived.
The math doesn’t lie.
Sources & Methodology
This article was developed using historical satellite imagery and publicly available agricultural information.
Historical Imagery
Google Earth Pro historical imagery (2000–2026)
USDA National Agriculture Imagery Program (NAIP), where available
Visual comparison of agricultural land use patterns in the Bowie and San Simon regions of southeastern Arizona
Geographic References
Interstate 10 corridor between Willcox, Arizona and San Simon, Arizona
Apple Annie’s Orchard
The Thing roadside attraction
San Simon Valley agricultural region
Agricultural Background
University of Arizona Cooperative Extension publications
USDA National Agricultural Statistics Service (NASS)
Arizona Department of Agriculture publications
Publicly available pecan industry and orchard management resources
Methodology
The analysis compares historical satellite imagery spanning approximately twenty-seven years. Land-use changes were identified through visual inspection of imagery over time, focusing on the transition from traditional irrigated field agriculture to permanent orchard cultivation.
The article does not attempt to identify individual landowners, farm operators, or specific business decisions. Instead, it examines observable landscape-level changes and discusses the broader economic implications of those changes.
All conclusions regarding land-use trends are based on publicly available imagery and observable changes visible in the historical record.