

“Tucson has approximately 166,000 acre-feet of water annual supply available for 100 years. This supply is designated to support 660,000 homes exceeding the projected demands of 130,000 acre-feet of water for 2034”
If you’re an engineer, hydrologist, or water manager, 166,000 acre-feet may immediately convey meaning. For the rest of us, it is simply a very large number attached to a very important issue.
That realization started me down an unexpected rabbit hole.
The Arizona Daily Star was reporting on housing and Tucson’s long-term water supply. The reporting was accurate, well sourced, and appropriately cautious. Yet I found myself unable to answer the most basic question a reader should be able to answer:
Is 166,000 acre-feet a lot?
I began searching for context. Instead, I found something stranger. One article measured rainfall in inches. Another discussed groundwater levels in feet below the surface. Another reported Central Arizona Project deliveries in acre-feet. Another measured household use in gallons. Lake Mead was described as a percentage full.
Every article was technically correct. Almost none of them spoke the same language. Imagine financial journalism written this way. Your income is reported in dollars. Your debt is reported in euros. Your investments are reported in Japanese yen. Inflation is measured in pesos. Every number would be perfectly accurate. The reporting would still leave most readers wondering how any of it related to the other.
Arizona water reporting has quietly developed the same problem. The issue isn’t the facts. It’s the language.
The Missing Ruler
Several weeks earlier, The Math Doesn’t Lie explored a simplified basin-wide study often used to explain groundwater recharge that approximately 3 percent of rainfall ultimately becomes groundwater recharge across Pima County.
Three percent of what?
Without a common measuring stick, even a useful assumption remains abstract. That became the objective of this investigation. Not to estimate Tucson’s water supply. Not to predict future shortages.
Simply to build a ruler that allows ordinary readers to compare water stories that currently exist in completely different units.
A Thought Experiment
This article is not attempting to calculate Tucson’s actual annual water supply. Water comes from multiple sources. Rainfall varies from year to year. Recharge is uneven. Urban development changes infiltration. Mountain watersheds behave differently than city streets.
Instead, let’s perform a simple normalization exercise.
We’ll make our assumptions explicit.
Assume:
The area is all of Pima County.
The county includes mountains, deserts, washes, farmland, recharge basins, and urban development.
We use the same simplified basin-wide study from our previous article: approximately 3 percent of rainfall ultimately becomes groundwater recharge.
We use 166,000 acre-feet only as a benchmark for comparison—not as a statement that one year of rainfall literally creates Tucson’s available water supply.
Now we ask a different question.
How much rain would have to fall across Pima County for three percent of it to equal approximately 166,000 acre-feet?
When the math is worked through, the answer is surprisingly familiar.
About 11.3 inches of rainfall captured across the square footage of Pima County.
Suddenly, something changes. The number is no longer an engineering unit. Almost everyone who has lived in southern Arizona has an intuitive feel for what eleven inches of annual rainfall means.
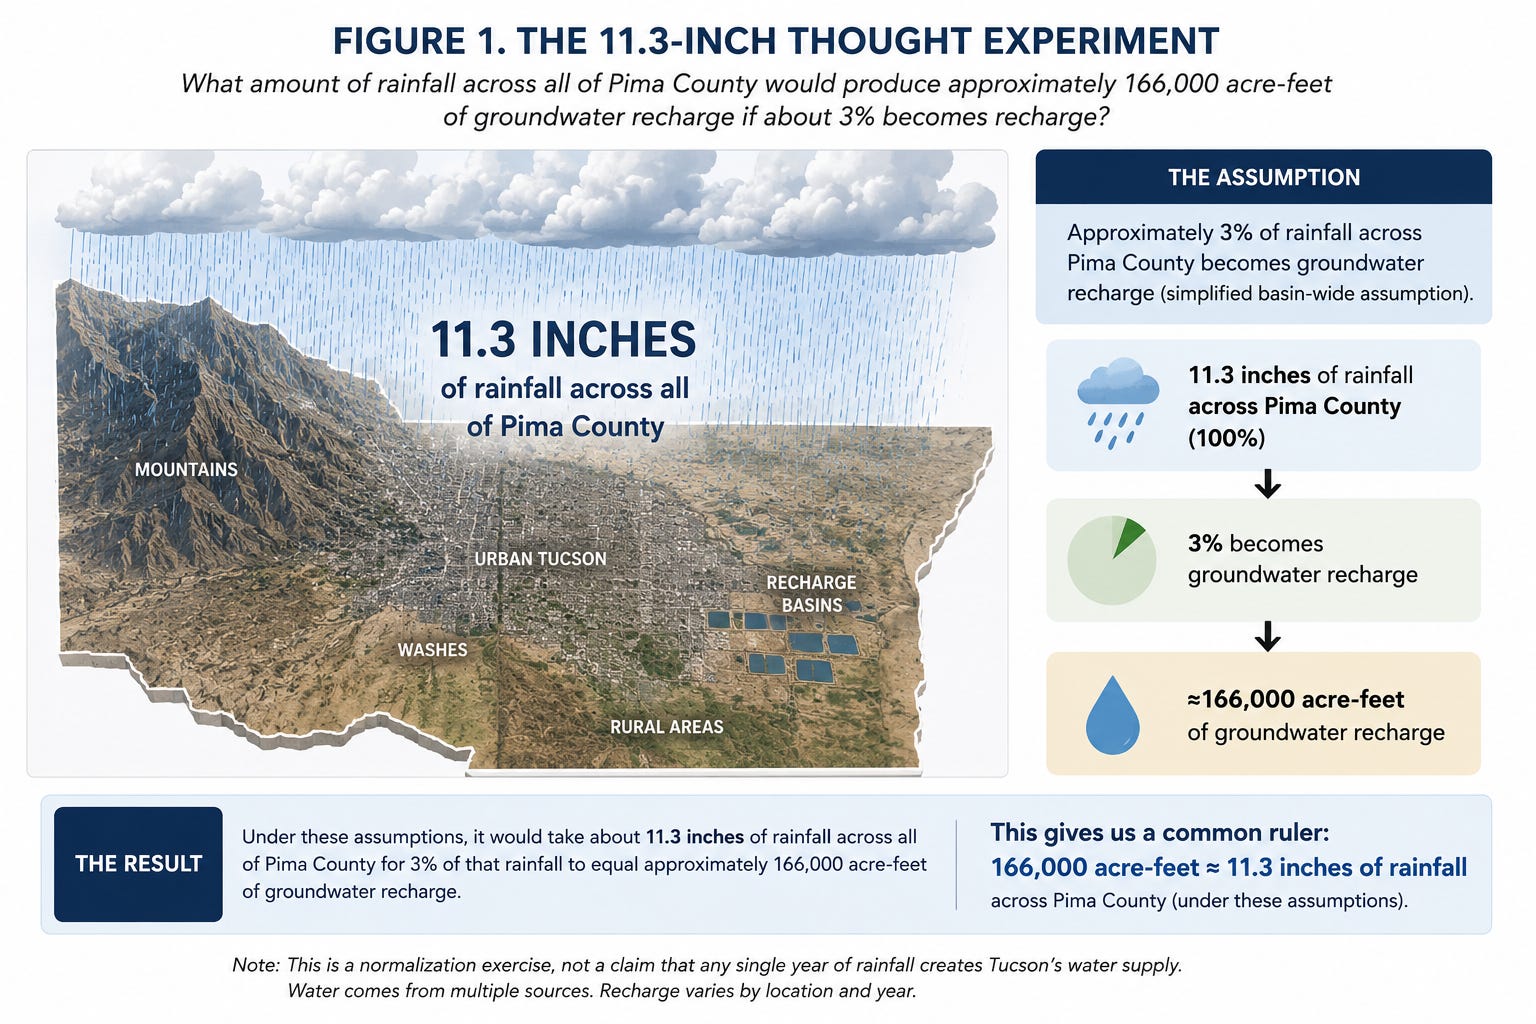
A simple illustration showing the area of Pima County receiving approximately 11.3 inches of rainfall, with a small highlighted portion representing the simplified 3 percent recharge assumption leading to approximately 166,000 acre-feet.
One Number Changes Everything
That single calculation is powerful because it gives readers a common ruler. Now other water stories become easier to interpret. Suppose annual rainfall is above average. You immediately know the benchmark. Suppose rainfall is well below average. Again, you have a reference point. Suppose someone proposes reducing Colorado River deliveries. You have another reference.
Rather than memorizing dozens of unrelated engineering units, readers can mentally compare everything against the same scale. The goal is not perfect precision.
Speaking the Same Language
Now that we have a common ruler, familiar Arizona stories begin fitting together. Average annual rainfall in Tucson suddenly has context. Historic wet years and drought years become easier to visualize. Central Arizona Project deliveries can be compared against a recognizable rainfall equivalent. Housing approvals become understandable rather than abstract. The debate shifts from memorizing units to evaluating tradeoffs.
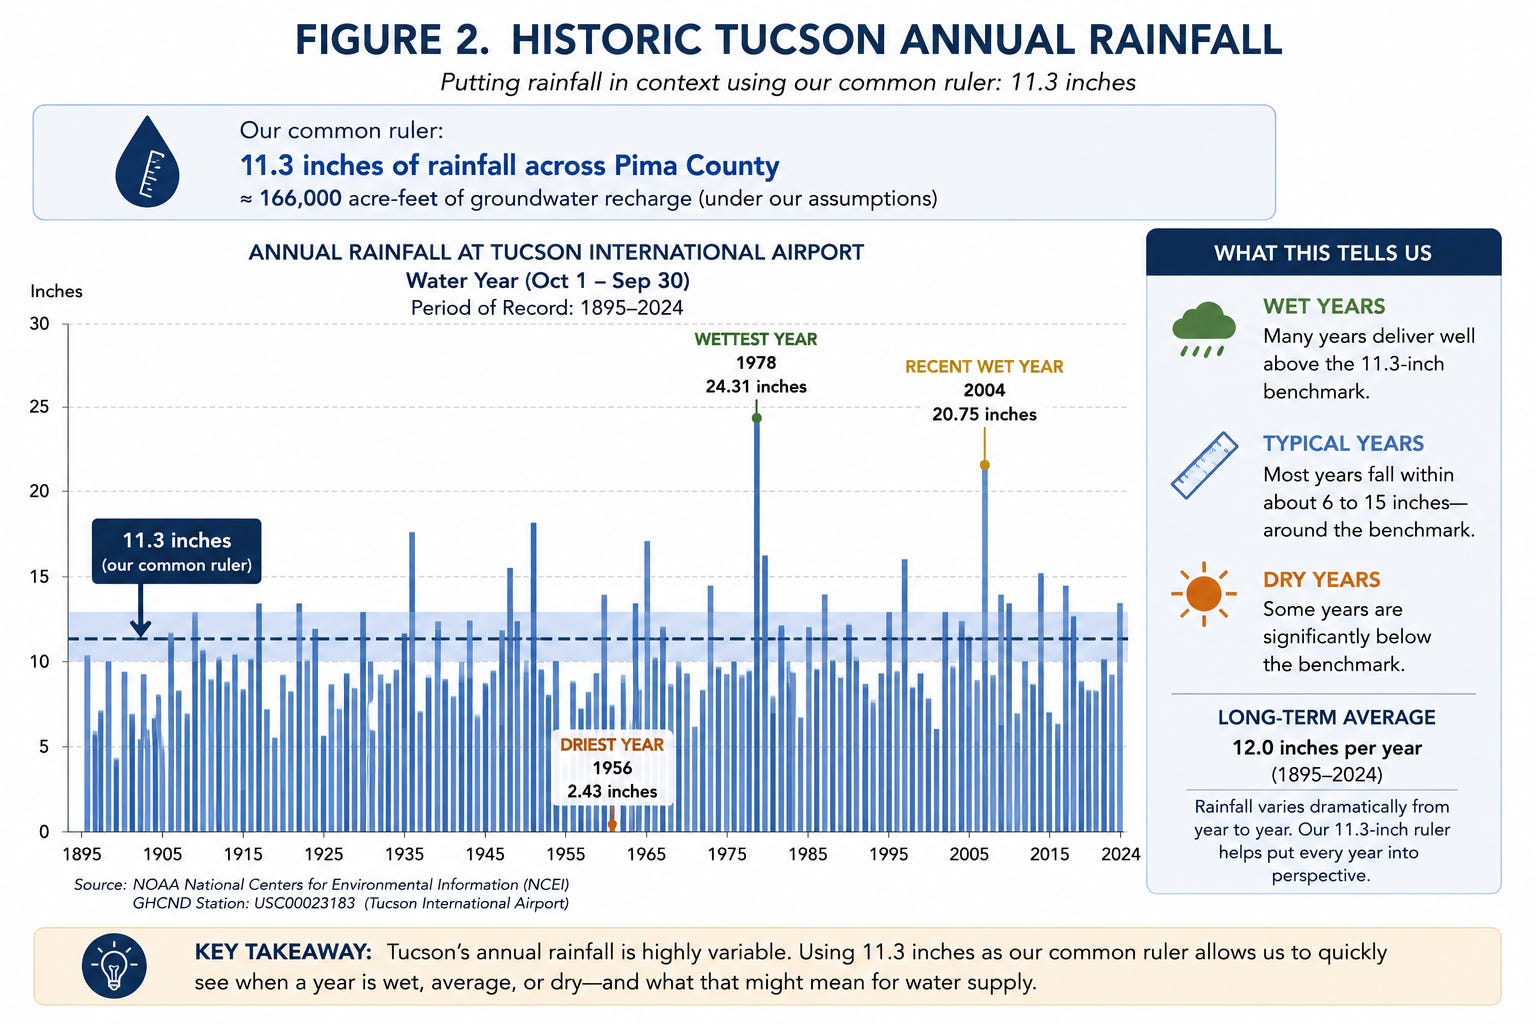
A chart showing long-term annual Tucson rainfall with the 11.3-inch benchmark highlighted.
Bringing CAP Into Focus
The Central Arizona Project delivers Colorado River water hundreds of miles into central and southern Arizona. Those allocations are almost always reported in acre-feet. Again, accurate. Again, difficult for many readers to visualize.
Once translated into our common ruler, readers can immediately understand whether proposed reductions represent modest adjustments or meaningful changes.
Future scenarios become easier to compare. Rather than seeing unrelated engineering figures, readers begin seeing scale. The debate becomes more informed. Not because anyone changed the data.
Because everyone is finally speaking the same language.
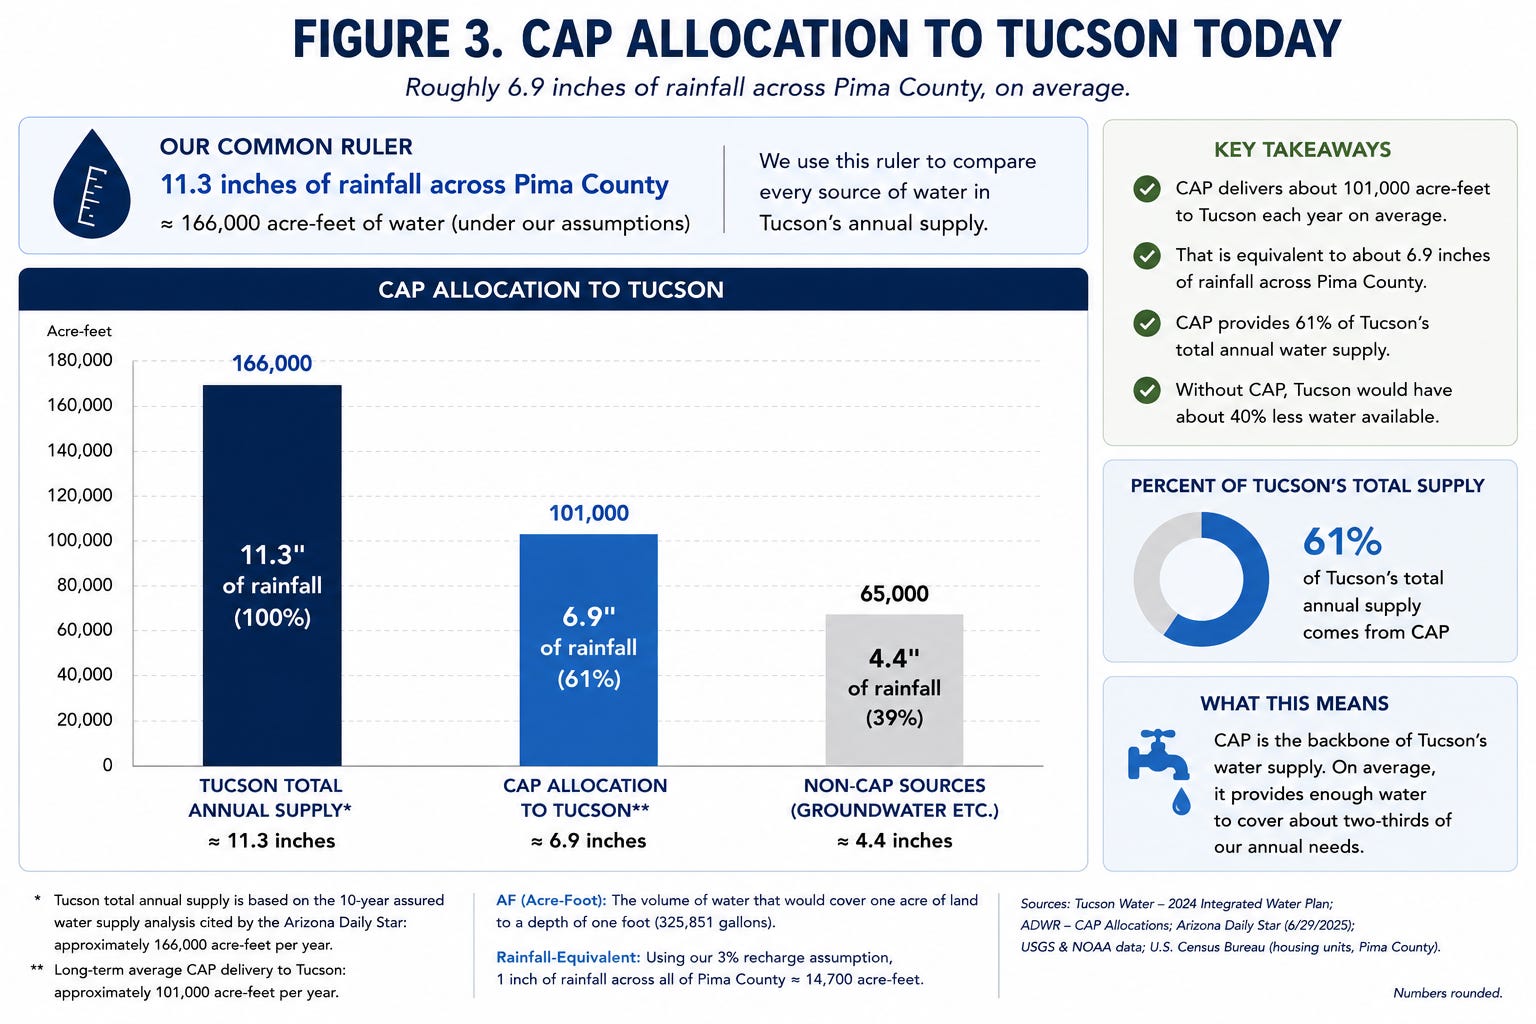
A comparison showing current deliveries normalized against the 11.3-inch benchmark.
Project Blue and the Importance of Scale
The proposed Project Blue data center has become one of the most discussed water projects in southern Arizona. Supporters emphasize investment and economic development. Critics focus on water demand. Both deserve careful consideration.
But before deciding whether the project is good or bad, readers deserve something simpler.
They deserve context. How much water would the project use? How does that compare to Tucson’s overall water availability? How does it compare with Central Arizona Project deliveries? How does it compare to the 166,000 annual supply acre-foot benchmark? How does it compare when translated into our common rainfall-equivalent ruler?
Those comparisons do not answer whether the project should proceed. They answer something equally important. They reveal scale. Public policy is difficult enough without forcing citizens to mentally convert between unrelated measurement systems.
Whether discussing housing, agriculture, manufacturing, or data centers, the first responsibility should be making the numbers understandable. For Project Blue, the initial water bill is equivalent to consumption of 290 homes per year and the recurring bill is equivalent to 50-60 homes per year.
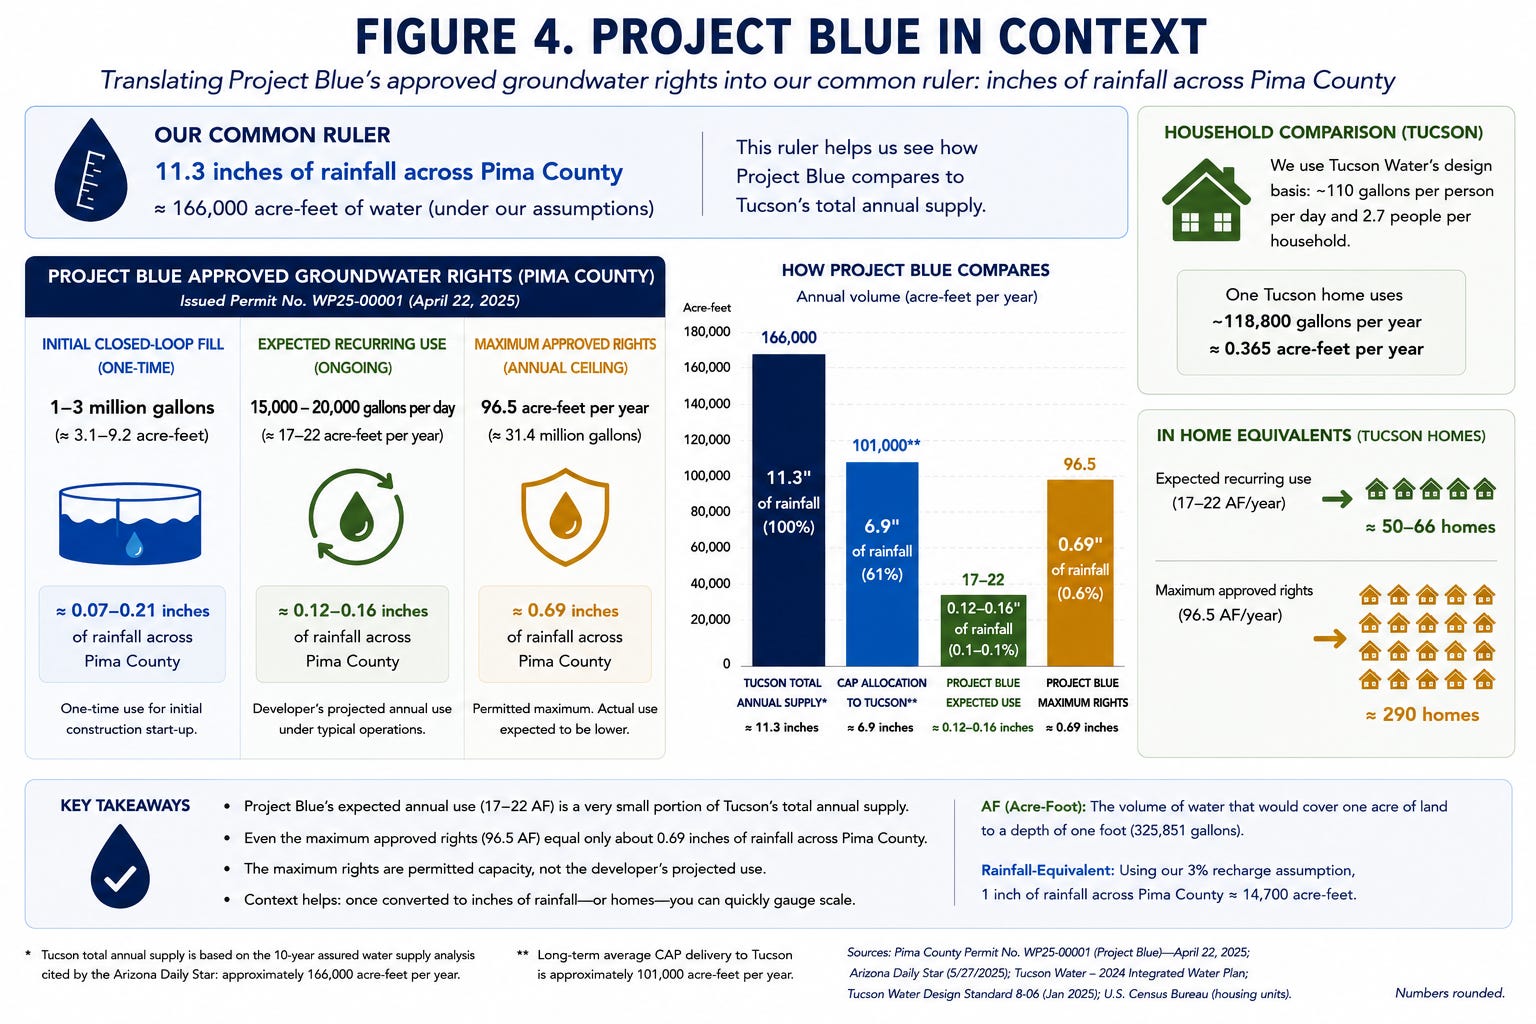
Comparison showing Project Blue’s initial demand, annual recurring demand, and secured groundwater rights relative to annual Tucson water availability and the 11.3-inch benchmark.
Why This Matters
Arizona will spend decades debating water: Growth, Agriculture, Housing, Mining, Industry, Climate, Infrastructure.
Every one of those discussions will include numbers. If those numbers remain disconnected, public debate becomes unnecessarily difficult. Citizens cannot meaningfully evaluate tradeoffs if every headline introduces a different measuring stick. Understanding does not require oversimplifying complex science.
It requires translating complexity into language people already understand. Good communication does not remove nuance. It creates intuition. And intuition is often what allows better questions to be asked.
Assumptions
This article intentionally simplifies a complex hydrologic system to create an intuitive comparison tool.
Primary assumptions include:
Pima County is treated as a single basin for normalization purposes.
A simplified basin-wide groundwater recharge assumption of approximately 3% is used, consistent with the earlier The Math Doesn’t Lie recharge article.
The 166,000 acre-foot figure is treated solely as a benchmark for comparison.
The resulting approximately 11.3-inch rainfall equivalent is a normalization exercise and not a claim that one year’s rainfall directly creates Tucson’s available water supply.
Different assumptions regarding recharge efficiency, geographic extent, or benchmark volume would produce different numerical results while preserving the article’s central concept: translating water quantities into a common unit.
Methodology
The methodology follows The Math Doesn’t Lie philosophy: Show your work.
Select a benchmark water volume (166,000 acre-feet).
Assume a simplified basin-wide recharge efficiency of approximately 3%.
Use the area of Pima County as the normalization area.
Solve for the annual rainfall depth that would produce the benchmark recharge volume under those assumptions.
Use the resulting rainfall depth (approximately 11.3 inches) as a common comparison ruler for other Arizona water statistics.
The calculation is intended to improve intuition rather than replace detailed hydrologic analysis.
References
Arizona Daily Star — Reporting on Tucson’s approximately 166,000 acre-feet of water available for future development.
Arizona Department of Water Resources (ADWR).
Central Arizona Project (CAP).
Tucson Water.
U.S. Geological Survey (USGS).
National Weather Service — Tucson Forecast Office.
National Oceanic and Atmospheric Administration (NOAA).
The Math Doesn’t Lie — “The 3% Recharge Assumption” (previous article).